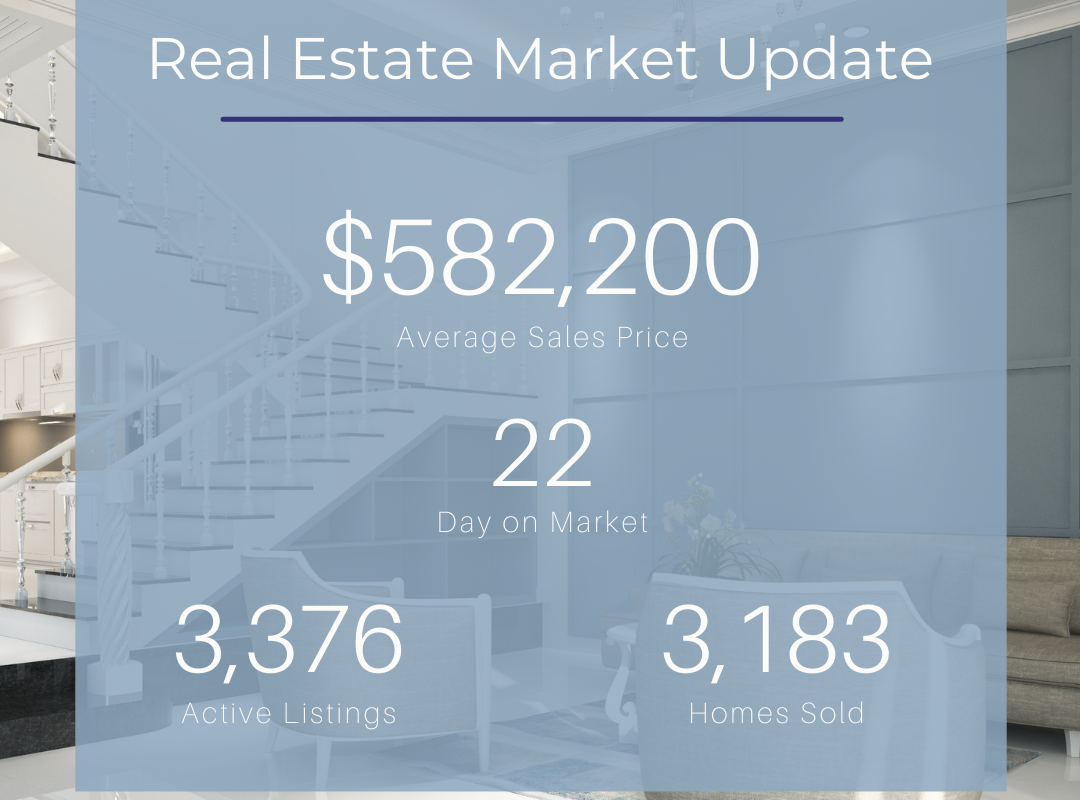
The Portland Metro Real Estate market continues to trend upward at a breakneck speed. In Oregon, the average sale price for the region jumped up another $24,300 over the prior month, and increased 24.5% ($114,700) over May of last year. The time that homes spend on the market continues to trend downward, sitting at 22 days for the whole region, though many Oregon areas of the Portland Metro are seeing total market time in the mid-teens.
In Clark County, Washington, the average sale price increased $19,500 over the prior month, and also increased 24.5% ($102,300) over May 2020. Total market time in Washington is even less than Oregon, sitting at 18 days, with many areas in single digits.
The Numbers
When comparing January 2020 through May 2020 to the same time period in 2021, new listings Oregon increased over 9%, pending sales increased by 25.5%, and closed sales increased by 25.2%. In Washington, new listings increased 12.4%, pending sales were up 25.7%, and closed sales increased 29.1%. This all makes sense if you consider the impact the early months of the pandemic had taken on our market during that time last year. In fact, we were just starting to see the market start to rev up in May 2020 after taking a big, cautionary pause when the world first shut down.
One of the most interesting caveats in our current market is the inventory levels, which ticked down slightly, once again, to our lowest level ever. New listings increased 16.1% in Oregon and 8.7% in Washington over May 2020, yet our currently inventory level is less than half of what it was a year ago in Oregon and is down over almost 75% in Washington. These numbers can be directly correlated to the number of buyers currently in the market compared to the same time last year. We have more houses coming on the market, but even more buyers looking to purchase. This continues to drive a very competitive environment which is still resulting in multiple offers and creative, generous offers winning the deal.
Notable Stats for Oregon
The Lake Oswego/West Linn area had the highest average sale price, which hit $928,300 in May, while the Eastside was the most affordable at $455,700. Beaverton/Aloha had the lowest total market time, sitting at just 12 days, while West Portland had the highest at 51 days. Lake Oswego/West Linn saw the largest price increase percentage jump between May 2021 and May 2020 at 16.3%. Beaverton/Aloha saw the lowest percentage increase at 8.1%, despite that low market time.
Notable Stats for Clark County
For Washington, the area NW E of 1-5 County saw the highest average sale price of $906,100, while the NW Heights are was the most affordable at $346,700. The W of 1-5 County area saw the lowest total market time at 3 days, while the N Hazel Dell had the highest at 123 days. The SW Heights area of Vancouver saw the largest price increase percentage jump from May 2021 over May 2020 at 22.8%, while The E Orchards area of Vancouver had the lowest at 7.9%.
In Summary
In summary, the whole Portland Metro Real Estate market continues to trend upward by the day. Will summer have any impact and cool things off slightly as people shift their focus to vacations and soaking up that gorgeous NW weather? Only time will tell, but it is clear that if you’re looking to make a move, now is the time to do it. Nationally, there is a big enough shortage in housing, that the experts see no easy remedy to our current situation.
If you’re looking to buy or sell in the Portland Metro, including SW Washington, contact Erica Parsons at Keller Williams Realty to get started! She’ll give you no pressure or smarmy sales tactics, just the honest help and guidance you need! Reach her at (503)706-8638 or hello@thatnwambiance.com.
Portland Metro Real Estate Market Update by City
Check out your specific city stats below…
Multnomah County
Clackamas County
- Boring OR
- Canby OR
- Clackamas OR
- Damascus OR
- Gladstone OR
- Happy Valley OR
- Lake Oswego OR
- Milwaukie OR
- Oregon City OR
- Sandy OR
- West Linn OR
- Wilsonville OR


Leave a Reply